Delivery & Governance · 11 min read
Capacity Planning: Find the Bottleneck Before It Finds You
Every team has one constraint that sets its speed. See it, protect it and plan around it instead of asking everyone to run faster.
 Dennis AlejoBusiness consultant · Project & operations manager · · 2,340 words

Think of a highway that has four lanes and suddenly narrows to two. Nothing about the cars changes. Each driver is competent, the road surface is perfect and the weather is fine. Yet traffic backs up for kilometers, and everyone arrives late. No amount of encouraging the drivers to go faster upstream will help, because the speed of the whole road is set by the two lanes at the narrowest point. The same thing happens in businesses and projects every day, only we cannot see the traffic.
This is the core of capacity planning: seeing where the narrowest point of your system is, protecting it and planning the rest of the work around it. It is the difference between a team that is constantly busy and a team that actually finishes things. In this article, I want to explain the key ideas in plain language, show how to find your bottleneck, give you a practical way to plan what your team can really do and share what changes when you apply it to different kinds of projects.
Capacity versus demand
Capacity is how much work a person, team or system can complete in a period of time. Demand is how much work is being asked of it. Many problems are simply a gap between the two, hidden by optimism. A team accepts five projects because each one sounds possible on its own, and nobody adds up the hours. Then everyone works late, quality slips and every project is delayed, including the ones that were most important.
A first discipline is to count honestly. Capacity is not the number of paid hours. People spend time in meetings, answering messages, handling administrative tasks, switching between jobs, taking leave and dealing with surprises. Many teams find that only about sixty to seventy percent of paid time is truly available for project work. Your number may be different, but you should measure it instead of assuming it is one hundred percent. If you plan with a number that is too high, every plan will be late before it starts.
The trap of being fully busy
There is a common instinct in management that a fully utilized team is an efficient one. It sounds right: why pay for idle time? But queueing theory, the mathematics of waiting lines, shows the opposite. As utilization approaches one hundred percent, waiting times rise sharply, not gradually.
Here is a simplified illustration based on a standard queueing model. Imagine a service where tasks arrive randomly and each takes an hour. At seventy percent utilization, a task spends about three hours in the system, counting both waiting and working. At eighty-five percent, it is closer to seven hours. At ninety-five percent, it is about twenty hours. The work did not get harder. The queue just grew, because there was no slack to absorb the random bursts of demand. The numbers are indicative, as real systems vary, but the shape of the curve is the point: the last few percent of utilization cost a disproportionate amount of speed.
That is why wise managers aim for a healthy buffer, not full utilization. The slack is not waste. It is the capacity to absorb surprises without delaying everything, and it is what allows a team to respond to an urgent request without breaking the plan.
The Theory of Constraints in plain English
In 1984, the physicist Eliyahu Goldratt published a business novel called The Goal, which introduced the Theory of Constraints. Its central idea is simple: in any system, one factor limits the overall result more than any other. Improving anything except that factor does not increase the output. Goldratt proposed five focusing steps, which translate well into everyday project language.
- Identify the constraint. Find the one step, resource or policy that limits the whole system.
- Exploit it. Make sure the constraint is never idle and is spending its time on the most valuable work. Remove tasks from it that someone else could do.
- Subordinate everything else. Adjust the rest of the system to support the constraint. Other steps should not overproduce, because extra output simply piles up in front of the bottleneck.
- Elevate the constraint. If it still limits you, invest to increase its capacity: add people, tools or hours.
- Repeat. Once the constraint is relieved, another one becomes the limit. Find it and begin again.
Notice that step four, spending money, comes after the three steps that cost almost nothing. Many organizations skip straight to hiring when a change in how work is arranged would have unlocked the same capacity.

How to find your bottleneck
The bottleneck is often obvious to the people who work near it and invisible to those who manage from a distance. Look for these signs.
A queue in front of it. Work waits before one particular step: reviews, approvals, a specific specialist, a machine, a slot for an inspection.
Idle time after it. The steps that come afterward often wait for work, because the bottleneck is not feeding them fast enough.
Overtime in one place. The same person or team works late repeatedly while others have gaps.
"Everything waits for X." When people say the project is stuck waiting for one person or one approval, you have found a likely candidate.
You can confirm it by measuring. Take a sample of recent items and record how long they spent at each stage, including waiting. The stage with the longest waiting time before it is usually the constraint. I use a version of this analysis in the calculator for hiring pipelines in staffing without the chaos, where the slowest stage in the path from first contact to a placed worker is where improvement starts. The logic works for any process with stages, from onboarding to approvals.
Plan capacity honestly
Once you know the constraint, plan the rest with real numbers. A simple method works for small teams.
First, list the people and how many hours each has in the coming weeks. Subtract leave and holidays. Then subtract recurring commitments: meetings, support duties, administration and routine work that is not part of any project. Apply a focus factor, a realistic percentage, perhaps sixty to seventy percent, to account for interruptions and switching. The result is the effective capacity available for projects.
Second, list the projects and the work each needs in the same period, using honest estimates, ideally in ranges. Compare the two totals. If demand exceeds capacity, you have three options: add capacity, reduce demand or accept delay. All three are legitimate choices, but the worst choice is to pretend the gap does not exist.
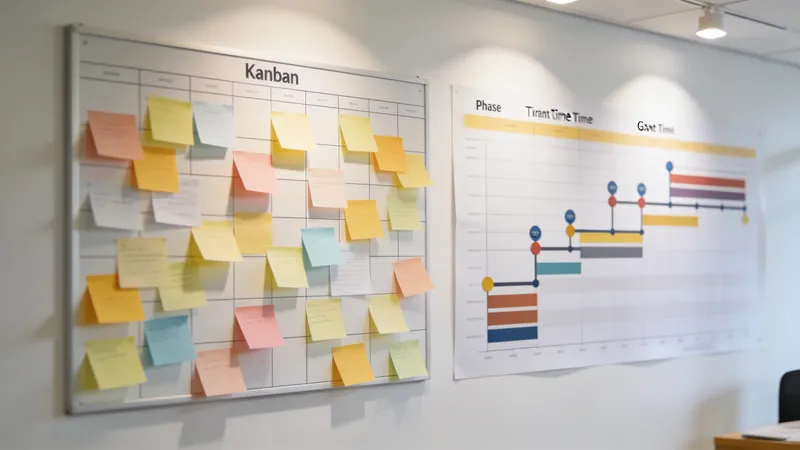
Third, put names against weeks on a visible board and look for peaks. One person overloaded in one week is a common sign of a hidden bottleneck. Adjust the plan, move work, split it or shift dates. Then review the board weekly as part of the rhythm in project governance for small teams.
Limit work in progress
There is a deceptively simple relationship, known as Little's Law, that connects three things: the average number of items in progress, the rate at which items are finished and the average time each takes from start to finish. In words: the average time to complete an item equals the number of items in progress divided by the completion rate. If your team finishes five items a week and has twenty in progress, each item takes about four weeks. If you limit work in progress to ten, and the completion rate stays the same, each item takes about two weeks.
This explains why starting more things makes everything slower, a lesson that many teams learn painfully. A cap on work in progress, a rule such as "no more than two items per person in progress at once," speeds up delivery without anyone working harder. I describe a calculator for this idea in shipping SaaS without chaos, and the principle holds for any kind of work.
The multitasking tax
Switching between tasks is not free. Each switch requires time to reload the context, and focus lost is rarely recovered fully. A person working on three projects at once does not deliver each at one third of the speed. They deliver each slower than that, because of the switching. Teams that sequence their work, finishing one thing before starting the next, often discover that the first deliverable arrives much sooner and the last arrives no later than before. Use the check below to see how healthy your own capacity planning is. Tick only what is already true.
Protect the bottleneck
Once you know where the constraint is, protect it.
Put a buffer in front of it. Make sure it always has work waiting, so it is never starved. The bottleneck's idle time is lost time for the whole system.
Take work off it. Anything that someone else could do should be moved. A highly skilled reviewer should not be formatting documents. A scarce inspector's slot should not be wasted on a half-ready site.
Prepare the work before it arrives. Check inputs upstream, so the constraint does not spend time on rework. A failed inspection that costs a slot is a failed week.
Do not overproduce upstream. Extra output before the bottleneck simply creates piles of unfinished work. Tie the pace of upstream steps to the pace of the constraint.

Leveling and smoothing
Project scheduling has two technical terms that are useful to know. Resource leveling resolves overloads by delaying tasks until resources are available, which may extend the end date. Resource smoothing adjusts the use of resources within the available float, without changing the end date. In practice, the choice reflects your priorities: if the date is fixed, you smooth and add resources, and if resources are fixed, you level and accept a later date. What you must not do is ignore the overload and hope.
A worked example: a four-person agency
Here is an invented illustration with simple numbers. A four-person agency has 160 paid hours a week. The team spends about 24 hours on meetings and administration and, this week, 8 hours on leave, which leaves 128 hours. Applying a focus factor of seventy percent for interruptions and switching leaves roughly 90 effective hours for client work.
The owner then lists the demand for the next two weeks: a website project that needs about 40 hours a week, a campaign that needs 35 and a report for a long-standing client that needs 45. That is 120 hours of demand against 90 hours of capacity, a gap of 30 hours a week, which nobody had written down. Until now, the team had simply felt "very busy and always behind."
With the gap visible, the owner has real options. She can move the report to the following week, since its deadline allows it. She can bring in a freelancer for part of the campaign, which raises capacity. Or she can ask the website client whether launching one week later would be acceptable. She chooses to delay the report and negotiate the campaign's start by three days. The team still works hard, but the work now fits, deadlines are honest and the most urgent project gets protected hours. The only tools she used were a spreadsheet and a calculator.
What the bottleneck looks like in different projects
In a restaurant, the constraint is often a single station, like the grill or the pass where plates are assembled and sent out. The whole kitchen is only as fast as that station, which is why the preparation in your restaurant is a project focuses so much on what happens before service starts.
In construction, the constraint may be a crane, a critical trade or the availability of an inspector. The opening of a healthcare space often depends on a few scarce events, as described in how a clinic opens on time.
In software, it is frequently a code review, testing or one person who knows a critical system.
In a lodge or hotel, such as Comtury Lodge, housekeeping turnaround between guests can set the rate at which rooms can be sold, while the kitchen or the guides may limit the experiences.
In exploration, the availability of a drill rig and the turnaround time at the laboratory limit how quickly results arrive, which is why programs like Llama Purisima are planned in stages with realistic timing for each.
In a recruiting pipeline, the scarce resource is often the time of the people who interview and decide.
Capacity across your projects
At the level of a portfolio, capacity planning becomes the art of saying no, or not yet. If your team can do three projects well, a fourth makes all four worse. This is why Project Focus insists on a small number of owned projects at a time and why the 90-day sprint limits a startup to three. A simple list of current projects, with the capacity each needs and the date each will finish, lets you see when a new request can fit. Automation can free capacity too, by taking repetitive work off the constraint, as in seven workflows to run on autopilot.
What you can do this week
You do not need a big initiative. This week, pick one team or process. List what is in progress. Ask where work waits the longest. Find the one step that everyone waits for. Choose one change from the five steps: exploit it by removing a task, subordinate by pausing an upstream push or cap the work in progress. Then look again next week. Teams that do this a few times describe a feeling of relief: fewer fires, more finished work and a calmer pace, with no one running faster.
Capacity planning is not about squeezing more out of people. It is about arranging the work so that the narrowest point is respected. If you would like help finding the constraint in your own operations and designing a plan around it, that is a large part of my scaling strategy service.
Where does work wait longest in your team? Tell me in the comments.
Frequently asked questions
What is capacity planning in project management?
It is estimating how much work a team can really complete in a period, comparing it with the work being requested and adjusting the plan, the people or the demand so that they match, with a buffer for surprises.
What is a bottleneck?
A bottleneck is the step, resource or policy that limits the output of the whole system. Improving anything other than the bottleneck does not increase the overall result.
Why is 100% utilization a bad target?
Because with no slack, any random burst of work creates a queue, and waiting times grow sharply as utilization approaches 100%. A healthy buffer lets a team absorb surprises without delaying everything.
How does limiting work in progress speed things up?
Average completion time equals items in progress divided by the rate of completion. If the rate stays the same, fewer items in progress means each item finishes sooner.
Join the conversation
Did this help? A quick reaction tells me what to write next.
Be the first to react.



Loading comments…